What is a light-planning project?
A light-planning project is a document that describes a complex lighting design. It contains lighting variables and displays possible lighting conditions of the given area. A light-planning project contains information on lights, their position, light intensity and light flux graphs.
The main goal of a light-planning project is to provide complete information on the most effective lighting option for the site. In order to pick the right solution, we have to test different lighting variants. The best solution is then picked in order to minimize your costs and maximize your energy savings.
The software visualization makes the designing process, calculation and system modelling more precise. The software can detect many potential problems. it also helps to visualize the quality and aesthetics of the proposed lighting solution.
If we really want the high quality light-planning project, we need to know as much as possible about the actual lighting conditions and your needs.
What is included in a light-planning project?
- Information about installed lights
- Light flux graph
- Light intensity display
- User level
- Table of variables
- Maintenance factor
- 3D visualization
1. Information about installed lights
Number and type of lights is the very basic information for every light-planning project. This part (Fig. 1) also contains light intensity data and light source intensity data (lumen). We have to keep in mind a difference between the light intensity of the light itself and the light intensity of the light source. The difference is obvious - the light source is the primary source of light (bulb, fluorescent lamp, gas-discharge lamp etc.), while the light represents the entire lighting system including the light source, shell, cover, cooler etc. The light intensity of the light itself is more important, because it also reflects loss and shows the real light intensity - the data we need for the light-planning project. Input represents the total energy consumption of the light.

Figure 1
2. Light flux graph
There are two curves plotted on a graph - blue and red one. The curves represent light flux “side view” and “en face”.
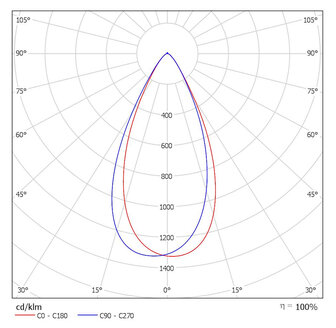
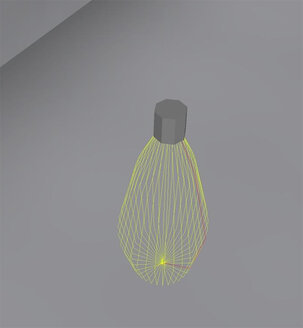
Figure 2 Figure 3
50° symmetric emission is shown by figure 2. Light flux emission in 3D is shown by figure 3.
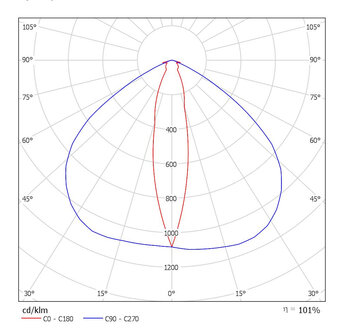
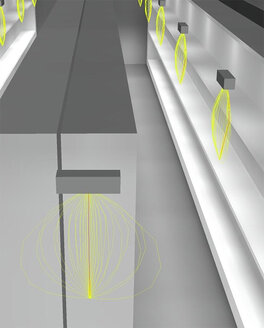
Figure 4 Figure 5
30°×70° asymmetric emission is shown by figure 4. In this case, the light flux emission in 3D is shown by figure 5.
If we use an adequate optical system, we can provide effective illumination of the site. A ray of light properly focused can save the energy (we don´t have to use more powerful light source).
3. Light intensity display
Light intensity graphic visualization plan is another part of the project. A simple rectangular plan can be used as an example (figure 6). Of course, the software can simulate any other shape. The lights are shown in red, so they are more visible.

Figure 6
The 100×18 m plan and individual lights location are dimensioned. We used 32 lights (shown in red). The room is 12 m high and the lights are placed in 11 m. Maintenance factor is 0.8 (this parameter is discussed in the chapter below).
The parameters are shown in lux (shown in green). Yellow curves show the light dispersion in the room. The blue line is an "edge zone" (to be discussed below).
4. User level
Working table height is a standard value to calculate a light intensity. In this case (figure 7), the table height is 0.85 m. Light parameters (in lux) (in green on figure 6) are also calculated for the table height.

Figure 7
The raster value (128x128 points) shows, how many raster points were used for the calculation. You can imagine the raster as a squared paper (each square represents a raster point).
One meter wide edge zone represents the zone, where no light is required, as the customer does not work there. You can set the width of the edge zone.
5. Table of variables

Figure 8
The following variables can be found in the table (figure 8):
„ρ“ – surfaces reflectance values (in %). Values in dusty areas (our data) are lower, while values reached in offices are higher. Reflectance value is very important for the calculation output.
„Em“ – average light distribution over a surface (edge zone taken into an account).
„Emin“ – minimum light distribution over a surface.
„Emax“ – maximum light distribution over a surface.
„Emin/Em“ – minimum light distribution and average minimum light distribution ratio.
Visualization software can calculate lighting parameters values for any partial zone anywhere in the room and in any height or angle (figure 9 and figure 10). We chose the entire user level (shown in pink) in figure 9 to be a sample zone for our calculation. Values for individual zones are shown in figure 10.
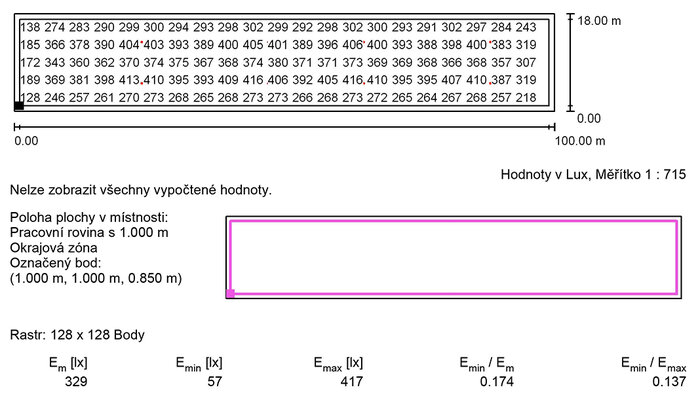
Figure 9
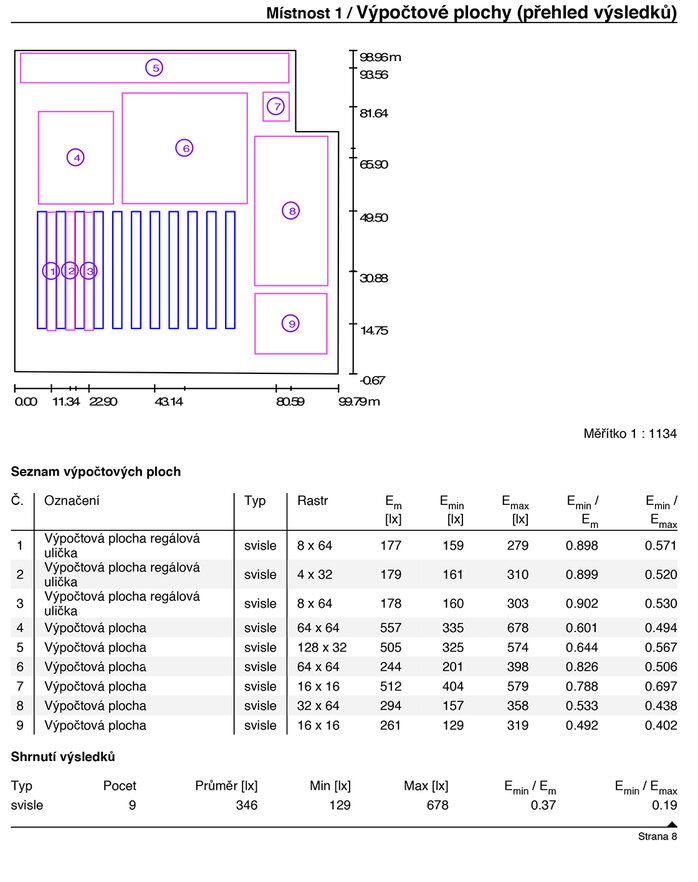
Figure 10
6. Maintenance factor
Maintenance factor represents a light wear, room dustiness, poor visibility, mist or steam present in the room. A new light installed in the room with no dust nor mist has the maintenance factor of 1.0.
But no matter what light is employed, the intensity of light always decreases with time. In order to provide you the light intensity we promised, we use the maintenance factor 0.8 when doing our calculations. LED lights average operation time is 50,000 hours/L70 if the room temperature is 25°C. L70 means the light would reach maintenance factor 0.7 after 50,000 hours of use.
Different illumination parameters depending on different maintenance factor values are shown by the following pictures (figure 11 and figure 12). Figure 11 shows the values at maintenance factor 0.7, figure 12 at 1.0. All the other input values remained unchanged.
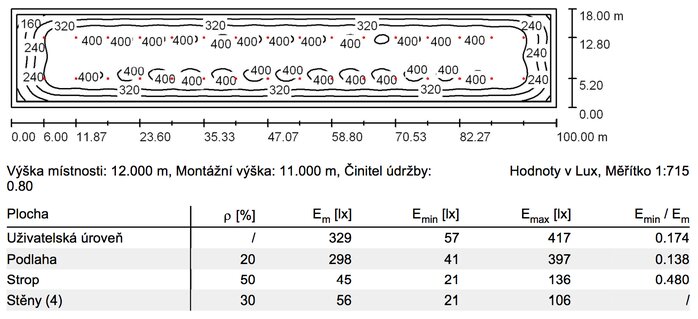
Figure 11
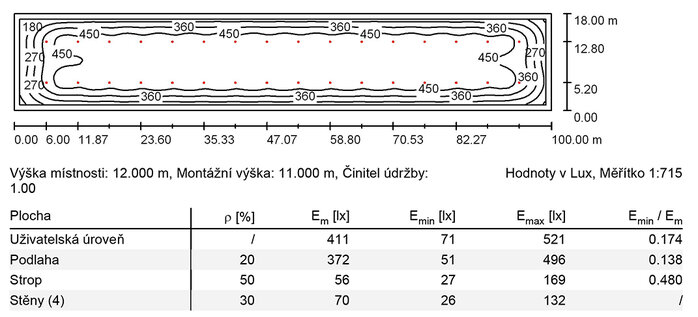
Figure 12
7. 3D visualization
3D visualization shows the light position in the room and the respective light flux (figure 13). False colour representation is used to show the situation in 3D room (figure 14). Use a colour scale to determine the light intensity (in lux) on the floor and walls.
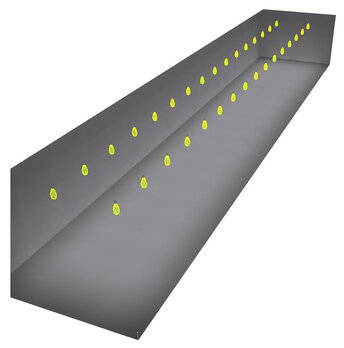
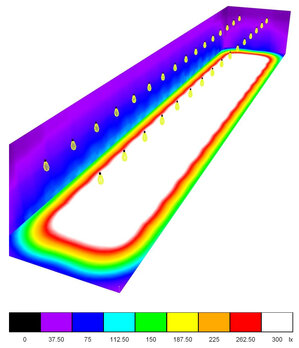
Figure 13 Figure 14
We hope our explanation has helped you to understand the light-planning projects better. Anyway, if you encounter any problem, feel free to contact us!
